|
Part 4
All text below is mine from 2023.
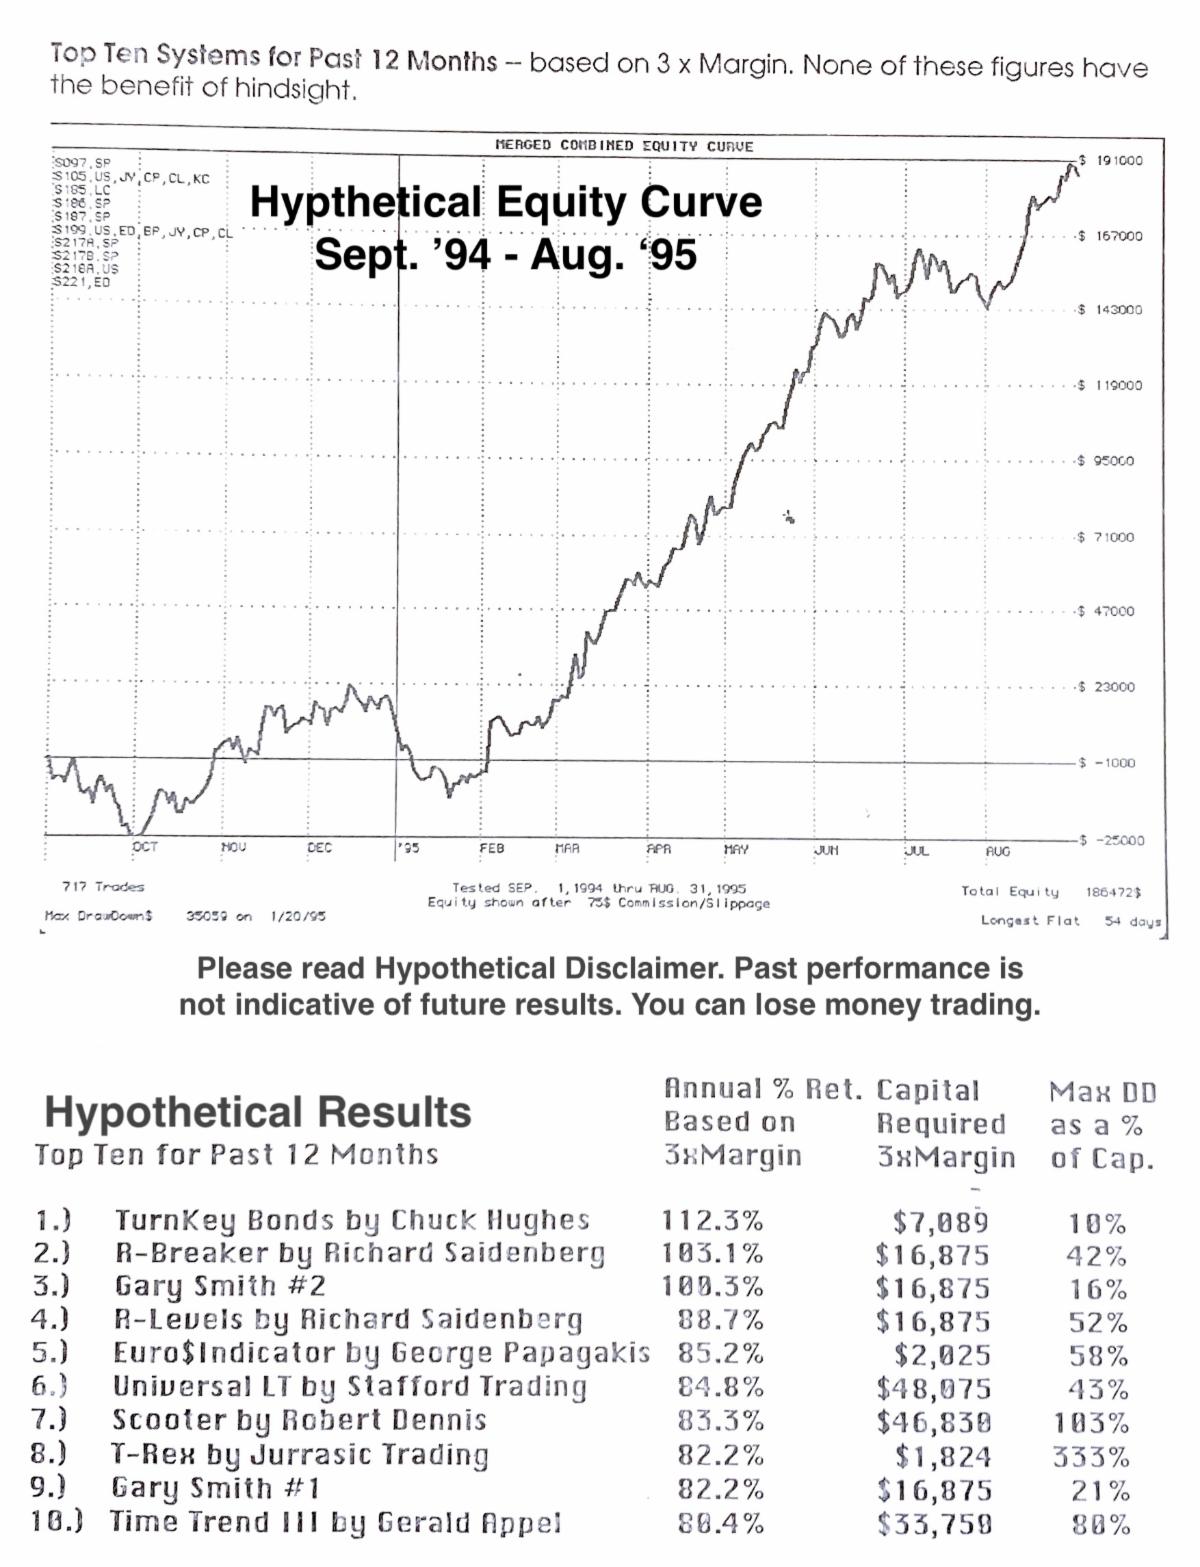
Below is the hypothetical equity curve of trading a basket of popular systems from the 90's. Please read hypothetical disclaimer and note past performance is not necessarily indicative of future results.
Several of these systems have promise today in my opinion.
The graph is the same. Performance is not changing. What is changing is initial capital allocation. This is an all important calculation. Allocate too little and you could be "shaken out" of a good system before a potential capital appreciation run. Allocate too much and you run the risk of capital MIS-allocation. Using money to trade that could be used better elsewhere.
Note that two systems have drawdowns greater than 100%. Further, our stance is that most traders / investors won't sit through a drawdown over 25%. This eliminates another five systems. Leaving us with three.
So which system(s) do we choose. One thought is to divide the percent return by percent max drawdown. This way, Turnkey has a number of 11, Gary Smith # 2 is 6. And, Gary Smith #1 is 4.
One final note on capital allocation. If you believe, as we do, that will stop trading a (potentially) good system on a 25% drawdown, then use 4 times maximum historical drawdown as the starting capital requirement.
Do you own research. System vendors in their quest to get clients will try to boost their percent returns by allocating as little as possible to the system. After all a 100% return is better than 25%. Not if the drawdown is also 100%.
Next week I will wrap up this series with a description of all these systems; some "logical conclusions" and characteristics of a "good" system.
|